Good To Know
This report covers Calgary's October 2026 housing numbers, released by CREB® in early November.
Every figure comes from CREB®'s monthly statistics for the City of Calgary, broken down by district and property type.
The benchmark price is CREB®'s measure of a typical home, so it shows price trends better than the average sale price.
This report is updated every month when CREB® releases new numbers. November's figures will be here in early December.
The Short Answer
Calgary's housing market cooled a bit more in October, but prices held up better than the headlines make it sound. Sales fell to 1,592, down 15% from last October, while the citywide benchmark price barely moved at $564,200, down just 0.4% from a year ago. Detached and semi-detached homes are holding steady. Condos and townhomes are where prices are slipping. And where you are in the city matters a lot: the West and City Centre are up, while the North East and East are down close to 6%.
I'm Mohit Dhillon, a Calgary REALTOR® with Century 21 Bravo Realty. Every month I go through CREB®'s numbers so you don't have to. Here's what October tells us, district by district.
Calgary Market at a Glance
Benchmark price: $564,200, down 0.4% from a year ago
Sales: 1,592, down 15.3%
New listings: 2,928, down 9.4%
Homes for sale (inventory): 6,173, down 4.6%
Months of supply: 3.88, up from 3.44 a year ago
Average days on market: 43
Homes sold for 97.3% of list price on average
Year to date: 17,878 sales, down 10.9%, with the benchmark price 2.7% lower than last year
Prices Are Holding, Sales Are Slowing
Here's the simple version. Fewer people are buying, but fewer people are selling too, so prices haven't dropped much. New listings fell 9% and inventory is almost 5% lower than last October. That's normal for this time of year. Sellers pull back as the weather turns, and the homes that are still listed face less competition.
The benchmark price started the year at $553,400 in January, climbed to $572,500 in June, and has eased back to $564,200 since. So we didn't get the usual spring bump this year, and prices have stayed in a fairly tight range all year.
CREB's chief economist Ann-Marie Lurie put it well: "Supply choice in the new, rental and resale markets has taken much of the pressure off prices this year." In plain words, buyers have options right now. New builds, rentals and resale homes are all competing for the same people.
How Each Property Type Is Doing
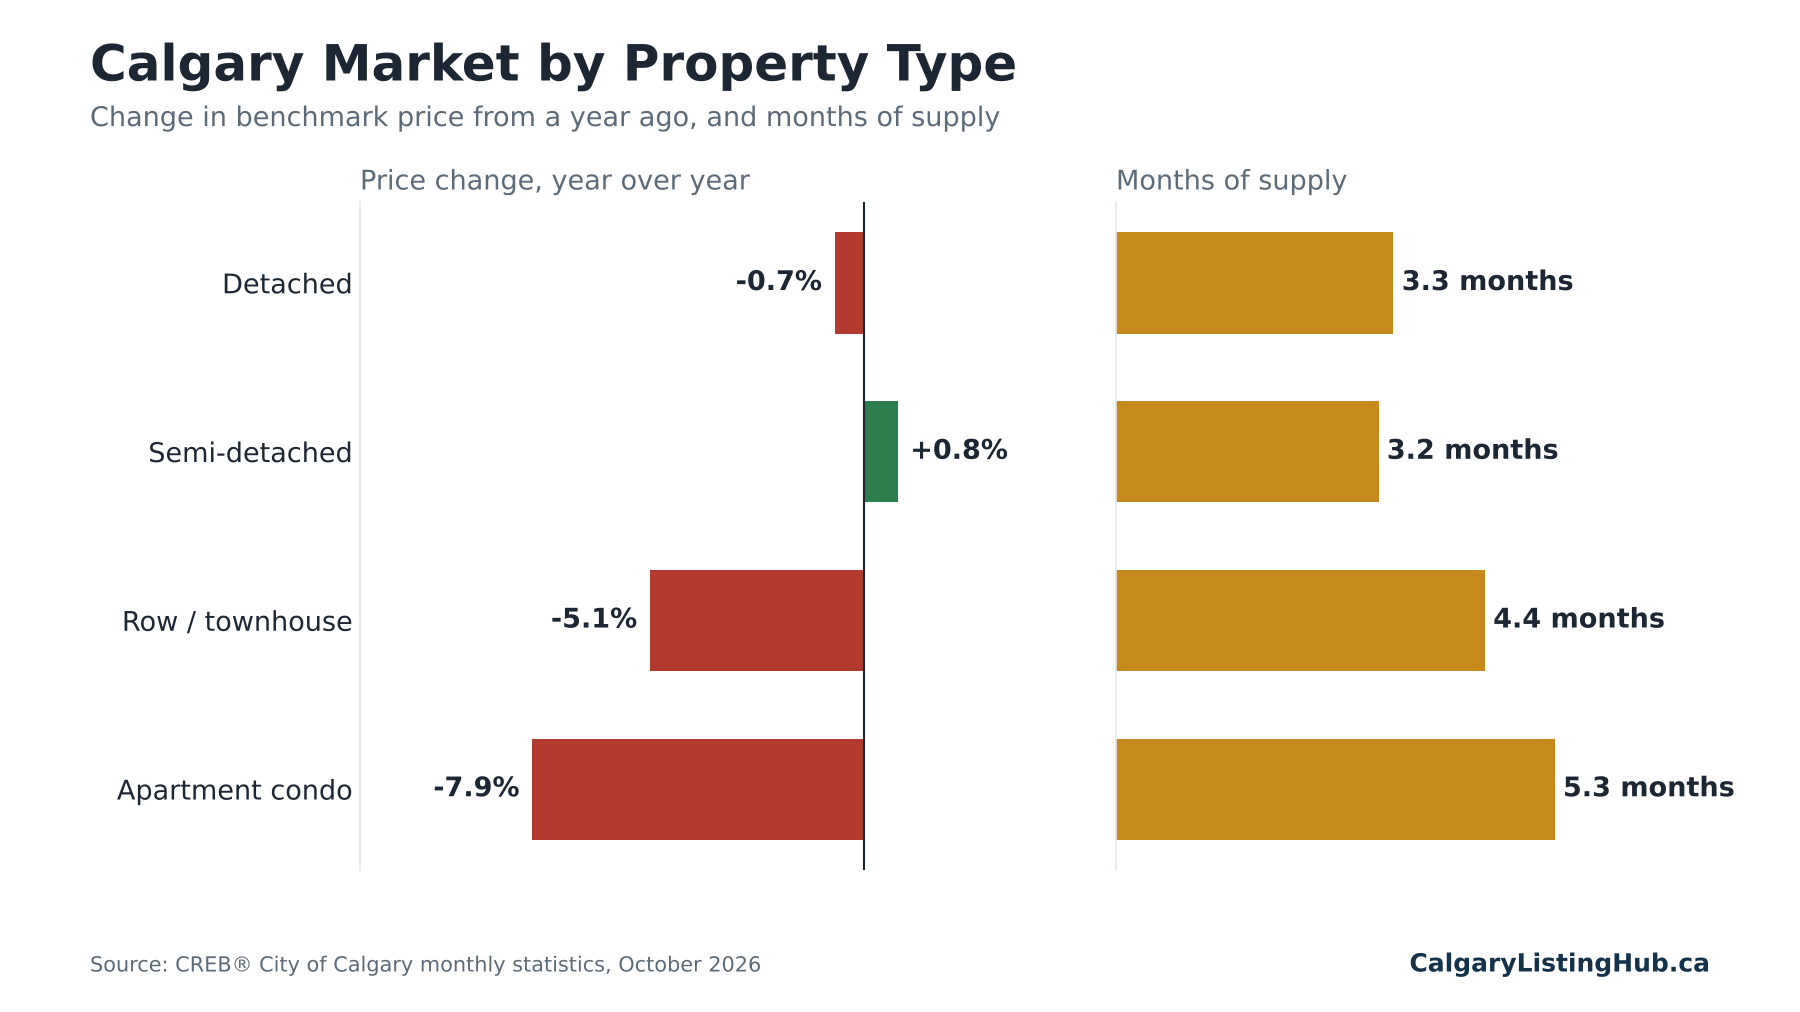
This is where the real story is. Calgary isn't one market. It's four different markets moving at different speeds.
Change in benchmark price from a year ago (each square = 1%)
🟩 Semi-detached, $685,200, up 0.8%
🟥 Detached, $735,100, down 0.7%
🟥🟥🟥🟥🟥 Row and townhouse, $407,500, down 5.1%
🟥🟥🟥🟥🟥🟥🟥🟥 Apartment condo, $288,800, down 7.9%
Months of supply (each square = half a month)
🟧🟧🟧🟧🟧🟧 Semi-detached, 3.2 months
🟧🟧🟧🟧🟧🟧🟧 Detached, 3.3 months
🟧🟧🟧🟧🟧🟧🟧🟧🟧 Row and townhouse, 4.4 months
🟧🟧🟧🟧🟧🟧🟧🟧🟧🟧🟧 Apartment condo, 5.3 months
Months of supply is how long it would take to sell every home on the market at the current pace. The higher it goes, the more room buyers have to negotiate. CREB says detached and semi-detached are still relatively balanced, while condos and townhomes now tend to favour the buyer.
Detached Homes
Detached sales fell to 847, about 16% lower than last year, but new listings dropped too, so there was no flood of homes. The benchmark price is $735,100, less than 1% lower than last year. Price gains in the City Centre and West weren't enough to cover the drops in the North East, North and East. If you're shopping in the detached range, our $500K to $750K homes and $750K to $1M homes pages show what's available right now.
Semi-Detached Homes
Semis were the one property type where sales went up from September. With 184 sales and only 302 new listings, the sales-to-new-listings ratio hit 61%, the highest of any type. Prices are steady at $685,200. For a lot of families, a semi is the sweet spot between a townhouse and a detached home, and the numbers show it.
Row Homes and Townhouses
Townhouse prices are down 5% to $407,500, with 4.4 months of supply. CREB pointed to competition from brand-new townhomes as a big reason. When a new one costs about the same as a resale, many buyers pick new. If you're selling a townhouse, pricing it right from day one matters more than ever.
Apartment Condos
Condos are the softest part of the market. The benchmark price is $288,800, down 8% from last year and about 15% below the peak in August 2024. There are over five months of supply, rents have eased, and new rental buildings keep coming. For first-time buyers, that's good news. For condo investors, it's a tough stretch.
Calgary Home Prices by District
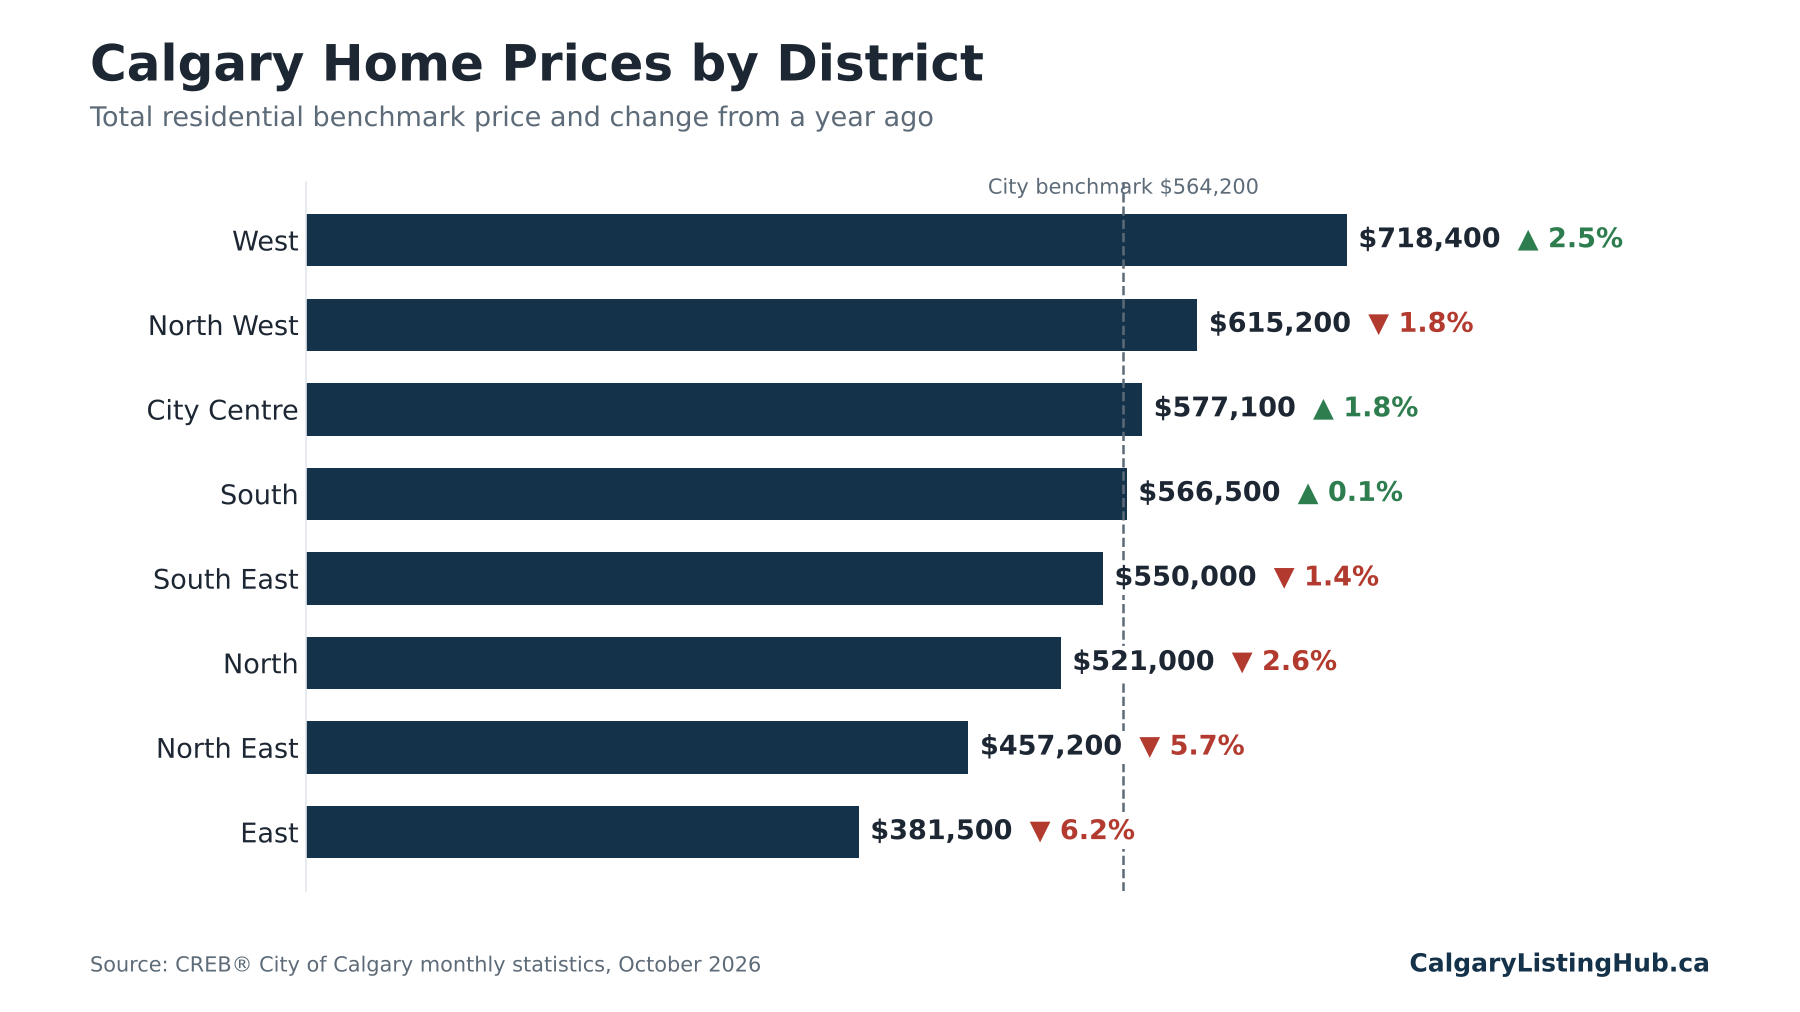
Here's every district's total residential benchmark price, from highest to lowest (each square = $50,000).
🟦🟦🟦🟦🟦🟦🟦🟦🟦🟦🟦🟦🟦🟦 West, $718,400
🟦🟦🟦🟦🟦🟦🟦🟦🟦🟦🟦🟦 North West, $615,200
🟦🟦🟦🟦🟦🟦🟦🟦🟦🟦🟦🟦 City Centre, $577,100
🟦🟦🟦🟦🟦🟦🟦🟦🟦🟦🟦 South, $566,500
🟦🟦🟦🟦🟦🟦🟦🟦🟦🟦🟦 South East, $550,000
🟦🟦🟦🟦🟦🟦🟦🟦🟦🟦 North, $521,000
🟦🟦🟦🟦🟦🟦🟦🟦🟦 North East, $457,200
🟦🟦🟦🟦🟦🟦🟦🟦 East, $381,500
And here's how much each district's prices changed from a year ago (each square = 0.5%).
🟩🟩🟩🟩🟩 West, up 2.5%
🟩🟩🟩🟩 City Centre, up 1.8%
⬜ South, up 0.1%
🟥🟥🟥 South East, down 1.4%
🟥🟥🟥🟥 North West, down 1.8%
🟥🟥🟥🟥🟥 North, down 2.6%
🟥🟥🟥🟥🟥🟥🟥🟥🟥🟥🟥 North East, down 5.7%
🟥🟥🟥🟥🟥🟥🟥🟥🟥🟥🟥🟥 East, down 6.2%
The pattern is clear. The established, higher-priced districts are holding or rising, and the more affordable districts with lots of newer supply are taking the biggest hit. Here's what's happening in each one.
District by District
City Centre
Total benchmark: $577,100, up 1.8%. Detached homes are up 3.3% to $992,500, the highest detached price in the city, and they're selling fast with a 62% sales-to-new-listings ratio. The catch is condos. The City Centre has 727 condos for sale and 5.2 months of supply, so the overall number hides two very different markets. Inner-city houses in communities like Hillhurst, Altadore and Bridgeland are strong. Condos in the Beltline are a buyer's market. If you're thinking about building, our infill homes page is worth a look.
West
Total benchmark: $718,400, up 2.5%, the best gain in the city. Detached homes are up 3.2% to $988,400 with just 2.5 months of supply, the tightest in Calgary. Two out of every three new detached listings sold. This is still a seller's area. Communities like Aspen Woods, Springbank Hill and West Springs keep attracting buyers who want space, good schools and quick access to the mountains.
North West
Total benchmark: $615,200, down 1.8%. Detached homes are at $765,500, down 2.5%, but supply is tight at under three months and 64% of new detached listings sold. Prices dipped a little, but the market is still active. Tuscany, Royal Oak and Varsity are the kind of communities that hold value well in a market like this.
North
Total benchmark: $521,000, down 2.6%. Detached homes sit at $635,700, down 3.5%. The bigger issue up here is condos and townhomes. The North has 9.5 months of condo supply, the highest in the city, and 6.7 months for townhomes. Lots of new construction in Livingston, Carrington and Sage Hill is giving buyers plenty of choice. Established areas like Panorama Hills are steadier.
North East
Total benchmark: $457,200, down 5.7%. Detached homes are down 6.6% to $548,000, one of the biggest drops in the city, and condos are down almost 12%. I grew up in the northeast, so I watch this one closely. A lot of new homes, many with legal basement suites, have been built here in the last few years, and that supply is weighing on resale prices. For buyers, this is the best value the northeast has offered in a while. Saddle Ridge, Savanna, Cornerstone and Redstone are worth a fresh look, especially homes with a spice kitchen or a basement suite.
East
Total benchmark: $381,500, down 6.2%, the largest drop of any district. Detached homes are down 6.8% to $463,800 and condos are down 13%. The East is still the most affordable part of Calgary, and prices this low make it interesting for first-time buyers and investors looking for older homes on decent lots. Forest Lawn, Penbrooke Meadows and Applewood Park are the ones I'd watch.
South
Total benchmark: $566,500, flat at up 0.1%. The South had the most detached sales in the city with 179, and detached prices are basically unchanged at $705,700. It's the steadiest district in Calgary right now. Townhomes here are also holding up better than most, with under four months of supply. Evergreen, Shawnessy and Lake Bonavista show why: established neighbourhoods, good access to Stoney Trail and Macleod, and steady demand.
South East
Total benchmark: $550,000, down 1.4%. Detached homes are at $695,700, down just 1.2%, with 3.2 months of supply. This is where I live, and it's been one of the more balanced areas all year. Lake communities like Mahogany and Auburn Bay keep their appeal, and Seton and Cranston pull steady buyers thanks to the hospital, shopping and new schools nearby.
You can browse every area on our Calgary communities page.
Detached Homes Compared to Condos Across the City
If you only look at one chart this month, make it this one. It shows how differently detached homes and condos are behaving in each district.
Detached homes, change from a year ago (each square = 0.5%)
🟩🟩🟩🟩🟩🟩🟩 City Centre, up 3.3%
🟩🟩🟩🟩🟩🟩 West, up 3.2%
🟥 South, down 0.6%
🟥🟥 South East, down 1.2%
🟥🟥🟥🟥🟥 North West, down 2.5%
🟥🟥🟥🟥🟥🟥🟥 North, down 3.5%
🟥🟥🟥🟥🟥🟥🟥🟥🟥🟥🟥🟥🟥 North East, down 6.6%
🟥🟥🟥🟥🟥🟥🟥🟥🟥🟥🟥🟥🟥🟥 East, down 6.8%
Apartment condos, change from a year ago (each square = 1%)
🟥🟥🟥🟥🟥 West, down 4.9%
🟥🟥🟥🟥🟥🟥🟥🟥 North, down 7.8%
🟥🟥🟥🟥🟥🟥🟥🟥 City Centre, down 8.0%
🟥🟥🟥🟥🟥🟥🟥🟥 South East, down 8.2%
🟥🟥🟥🟥🟥🟥🟥🟥🟥 North West, down 8.9%
🟥🟥🟥🟥🟥🟥🟥🟥🟥 South, down 9.2%
🟥🟥🟥🟥🟥🟥🟥🟥🟥🟥🟥🟥 North East, down 11.8%
🟥🟥🟥🟥🟥🟥🟥🟥🟥🟥🟥🟥🟥 East, down 13.1%
Condo prices are down in every single district. Detached homes are up in two districts and only slightly down in most of the rest. That gap is the biggest thing to understand about Calgary's market right now.
The $1.5 Million and Up Market Is Busier
Here's one most people miss. While overall sales are down 11% this year, sales of homes over $1.5 million are up. There have been 632 sales above $1.5 million so far this year, compared with 524 at this point last year, an increase of about 21%. In October alone, 69 homes sold above $1.5 million, up from 57.
That's a big reason the average sale price is up 2.3% this year even though the benchmark is down. It's also why we keep seeing relocators from Toronto and Vancouver buying at the top end. If that's your price range, take a look at Calgary luxury homes and homes over $1.5 million.
What the Rate Hike Adds
Most of October's sales happened before the Bank of Canada raised its policy rate to 2.5% on October 28, the first hike since 2023. Prime is now 4.70%. That will show up in November and December's numbers, mostly by trimming how much some buyers can qualify for. I broke down what it means for payments on our blog, and you can run your own numbers with our mortgage calculator. The Bank's next decision is on December 9, per the Bank of Canada.
What This Means for You
If You're Buying
You have more choice than you've had in years, especially in condos, townhomes and the northeast.
Homes are selling for about 97% of list price on average, so there's room to negotiate. On condos and townhomes, there's even more.
Winter is a good time to buy. Fewer buyers are out, and sellers who list in November and December usually need to move.
Keep an eye on price reductions and new listings, and lock in a pre-approval before rates move again.
If You're Selling
If you own a detached home in the West, City Centre or North West, you're still in a strong spot.
If you're selling a condo or townhouse, price it right from day one. With five months of supply, buyers will skip anything that looks high.
Less competition in winter can work in your favour. Inventory is down almost 5% from last year.
Start with a free home evaluation, or see what your neighbour sold for. When you're ready, here's how I list homes.
If You're Investing
What I'm Watching in December
Three things. First, whether the rate hike slows detached sales or just shifts buyers to cheaper homes. Second, whether condo and townhouse inventory keeps dropping into winter, which would help those prices find a floor. Third, the North East and East. If prices there keep falling, they'll start to look like a real bargain compared with the rest of the city, and I expect buyers to notice.
Want to know what this means for your home or your next purchase? Get in touch, call or text me at (587) 719-5523, or learn more about me at MohitDhillon.com. I work in English, Punjabi, Hindi and Urdu. For the bigger picture, see our full Calgary real estate market update page.
Frequently Asked Questions
Are house prices going down in Calgary?
Only slightly overall. CREB's citywide benchmark price was $564,200 in October, down 0.4% from a year ago. Detached and semi-detached prices are close to flat, while condos are down about 8% and townhomes about 5%.
Is Calgary a buyer's or seller's market right now?
It depends on what you're buying. Detached and semi-detached homes are relatively balanced, with just over three months of supply. Condos and townhomes lean toward buyers, with over four and five months of supply.
Which part of Calgary has the most expensive homes?
The West district has the highest total benchmark price at $718,400. For detached homes, the City Centre ($992,500) and West ($988,400) are the most expensive.
Where are the cheapest homes in Calgary?
The East district has the lowest total benchmark price at $381,500, followed by the North East at $457,200. Both districts have seen the largest price drops over the past year.
Is now a good time to buy a condo in Calgary?
For someone buying to live in, it's one of the best times in years. Condo prices are down about 8% from a year ago and there are over five months of supply, so you have room to negotiate. For investors, rents have eased, so run the numbers carefully.
What is the benchmark price?
The benchmark price is CREB's estimate of what a typical home sells for. It adjusts for the mix of homes sold each month, so it's a better measure of price changes than the average or median price.
Source: CREB® City of Calgary monthly statistics. This update is general information and not financial advice.